By Garry K. Smith © 1998
Member - Australian Speleological Federation and the Newcastle & Hunter Valley Speleological Society. P.O. Box 15 Broadmeadow. N.S.W, 2292 Australia.
Principal Technical Officer - BHP Research Laboratories. P.O. Box 188 Wallsend, N.S.W, 2287 Australia.
First Published in the ASF 22nd Biennial Conference Proceedings 1999, Pages 48-58
Introduction
‘Foul Air’ is a life threatening hazard which speleologists may encounter in caves with relatively still atmospheres. Although not a significant problem in the majority of caves around the world, those containing concentrations of foul air may become death traps for cavers not familiar with the signs and symptoms of the gases involved.
‘Foul Air’, sometimes called ‘Bad Air’, is a cave atmosphere which has a noticeable abnormal physiological effect on humans. In limestone caves, ‘foul air’ can be described as containing greater than 0.5% carbon dioxide (CO2) and/or lower than 18% oxygen (O2) by volume. As a comparison, normal air contains approximately 0.03% CO2 and 21% O2 by volume. However there are some isolated caves which contain atmospheres influenced by other gases such as:- methane, ammonia, hydrogen sulfide or carbon monoxide, but these gases are generally rare in limestone caves.
An elevated CO2 concentration is usually the most life threatening foul air scenario found within Australian limestone caves. This colourless, odourless and non-combustible gas is the body's regulator of the breathing function. In industry the maximum safe working level recommended for an 8 hour working day is 0.5% (5,000ppm by volume). A concentration of 10% or greater can cause respiratory paralysis and death within a few minutes.
To the novice caver the first encounter with foul air is often a frightening experience. Typically there is no smell or visual sign and the first physiological effects are increased pulse and breathing rates. Higher concentrations of CO2 lead to clumsiness, severe headaches, dizziness and even death. Experienced foul air cavers can notice a dry acidic taste in their mouth, however the average caver may not notice this effect.
Strang and Mackenzie-Wood, (1990) state that, “Carbon Dioxide is regarded as a ‘hot gas’ due to its low thermal conductivity, heat is not conducted away as rapidly as in normal air so a person standing in it feels warm about his lower limbs”.
Types of Foul Air in caves
The Foul Air Types used below were first characterised by James (1977) and expanded upon by Halbert (1982) with the use of the Gibbs Triangle and the Cave Air Index.
1.In this scenario, “Foul Air Type 1”, CO2 is absorbed by the ground water as it passes through surface soil containing high concentrations of the gas, due to the decay of vegetation. Soil CO2 contents can reach as high as 10 to 12%, however most values range between 0.15% and 0.65%. The resulting weak carbonic acid percolates through the rock strata and enters the cave system, usually taking part in the calcite deposition cycle. In this instance the addition of extra CO2 to the cave atmosphere equally displaces O2 and nitrogen (N2) in direct proportion to which they constitute the atmosphere being displaced. See Table 2.
Atmospheres consisting strictly of “Type 1” foul air, rarely exceed 1% CO2. An example of this atmosphere could contain 1% CO2 and 20.8% O2.
Halbert (1982), relates “Foul Air Type 1” cave atmosphere to the introduction of CO2 into the cave atmosphere and all other components are diluted - the source of the CO2 is immaterial. An atmosphere resulting from purely a type 1 process occurs quite slowly and it requires five percent CO2 to reduce the O2 level by one percent.
2.In the second scenario “Foul Air Type 2” the CO2 is a by-product of organic and micro-organism metabolism or respiration by fauna such as bats or humans. In this instance the oxygen concentration is reduced in proportion to the increase in CO2. The N2 concentration stays constant. See Table 3.
Halbert, (1982) “Foul Air Type 2” describes in great detail the relationship between consumption of O2, and production of CO2 in the metabolic process of living organisms. Essentially the volume ratio of CO2 produced to O2 consumed, called the “respiratory quotient” (RQ) is not constant and can vary between 0.7 and 1, depending on organic matter involved. ie. carbohydrates, fats or protein. If fats were utilised solely in the metabolic process the RQ = 0.7, and would result in a consumption of O2 with a relatively smaller amount of CO2 volume being produced in return.
3.In the third scenario, “Foul Air Type 3”, cave atmosphere which has resulted from the introduction of other gasses, such as methane and nitrogen and the non-respiratory uptake of O2 as well as CO2 stripping by water. Another example is “stink damp” so named because it often contains hydrogen sulfide and the O2 is significantly more depleted than in “Type 2”. Foul air consisting strictly of “Type 3” are rare in caves and therefore is only dealt with briefly in this paper.
Also falling into Halbert’s third type is an atmosphere which has resulted from a combination of scenarios 1&2 with addition of another mechanism (“Foul Air Type 3”), which alters the gas concentrations.
James, (1977) recognised six sources of CO2 in cave atmospheres,
a) evolution from cave waters
b) production from micro-organisms
c) respiration of plants and animals
d) Diffusion of gaseous CO2 into the cave
e) Burning of hydrocarbons
f) Volcanic emission
Of these the first three are covered in scenarios 1&2. Not considered in this paper is source d) which is an external source of CO2, generally of a sporadic nature and the last two don’t have any real significance in Australian Caves.
Influencing factors in CO2 concentration.
Even though CO2 is 1.57 times heavier than nitrogen and 1.38 times heavier than O2, it has a tendency to disperse in an isolated volume of air, due to molecular diffusion. In other words, a mixture of gasses will not separate into layers of various density gases if it is left for a long time in a still chamber. On the other hand, various gasses purged separately into a closed container will become uniformly mixed over a period of time. A possible explanation of the high concentration of CO2 in deep caves (with a relatively still atmosphere), is that CO2 is being produced metabolically or entering the cave via ground water at a greater rate than the gas can disperse (by molecular diffusion) into the cave atmosphere, thus settling or remaining at the bottom of the cave because it is a dense gas. (Smith. G. K. 1997a)
‘Foul air’, is often encountered in pockets at the lower sections of deep caves where there are no active streams and air movement is minimal. Frequently there appears to be a definite boundary between ‘good air’ and ‘foul air’, with a noticeable elevation in CO2 concentration being present. In caves containing ‘foul air’ the author has on numerous occasions experienced these invisible boundaries with a transition of less than one metre. Often there isn’t a gradual transition in air quality as one might expect if dispersion of the gases were occurring at a relatively fast rate. In Australia most of these atmospheres can be attributed to ‘Foul Air Type 2’, or a combination of (2+1) or (2+3), however the CO2 is being introduced into a relatively still cave atmosphere and molecular diffusion is insufficient to disperse the gas with an even gradient over the vertical range of the cave.
This build up in CO2 concentration is more prevalent in deep caves, however it can still be found in some shallow caves with a vertical range of less than 10 metres. A very still cave atmosphere may allow CO2 to sink to (or remain at its origin in) the deepest part of the cave and displace O2 and N2. This allows CO2 to build up to a higher concentration, at the lowest point. An example of this would be Suicide Hole Cave at Crawney Pass N.S.W, which has a vertical range of approximately 6 metres and contains a high concentration of CO2 in the bottom two metres of cave passages. The CO2 can be attributed to a large number of fine tree roots in a passage just above the foul air.
An example of how CO2 can be liberated and build up to high concentrations in the bottom of caves is suggested by Osborne, (1981), in a study of the ‘CO2 Pit’ in Gaden Cave - Wellington NSW Australia. Osborne surmises that the atmosphere is most likely due to degassing of the extensive bodies of still water in the underground lake system. This relates to a strictly foul air type 1, however Osborne conjectures that the test measurements indicate a type 2 foul air is also involved.
Indications are that the gas is being introduced into the cave atmosphere at a greater rate than it can disperse by molecular diffusion, thus a very definite boundary occurs. In the ‘CO2 Pit’, the boundary between good breathable air and life threatening foul air is often less than 0.4 metre. Recent discussions with divers undertaking mapping and photographic projects indicate that the extensive underground lakes are well known for their acidity and constant production of calcite rafts. This strongly supports the theory put forward by Osborne, that the majority of the foul air in the ‘CO2 Pit’ is due to Type 1 with the addition of some Type 2.
James & Dyson (1981) found at Bungonia, NSW Australia, that “CO2 is encountered at a threshold and below the threshold it appeared to be relatively homogeneously mixed”. While “……caves with flowing streams which terminated in sumps showed a pronounced CO2 gradient, increasing with depth”. Drum Cave generally followed this pattern, however during bat maternity season, an inverted gradient was observed even when the stream flowed. The bats respiration and micro-organisms in the guano were concluded to be the major sources of CO2, and were responsible for the highest recordings in the cave, (measured in the entrance series chamber). The CO2 concentration was observed to decrease down the cave toward the terminal sump. They conclude that “in general, CO2 is located in the cave close to the source of its production”.
Another factor was highlighted with a study of Grill Cave at Bungonia. This cave is known to regularly contain foul air (which has a short transition distance between good air and hazardous foul air), the relative depth from the surface, (of the interface), varies considerably with climatic change and correlates with highs and lows in atmospheric pressure. The high atmospheric pressure compressing the gasses, thus pushing the interface deeper into the cave and the reverse with atmospheric lows. This can be greatly enhanced by passage dimensions and volume capacities of chambers within a cave system. (Smith G. K., 1998).
Temperature changes outside caves also have an effect on the concentration of foul air. Jennings, et al. (1972) give the example of caves at Bungonia where the average underground temperature is 17.75°C. During summer the above ground air temperature rarely drops below this temperature, hence the cold, dense air remains in the lower levels without circulating. However during winter the caves “breathe”. The warmer air rises, thus causing an expansion of the CO2 regions with a reduction in CO2 concentration.
Floods are also known to reduce high concentrations of ‘foul air’ as the influx of large volumes of fresh water absorb CO2 from the cave atmosphere and transport it away. O2 is also liberated from the fresh water into the cave atmosphere. Floods also carry into the cave, fresh organic matter which micro-organisms feed on to rapidly increase CO2 once the water flow has subsided. Micro-organisms can increase CO2 concentration in the cave atmosphere by several percent over a 48 hour period. (James and Dyson, 1981)
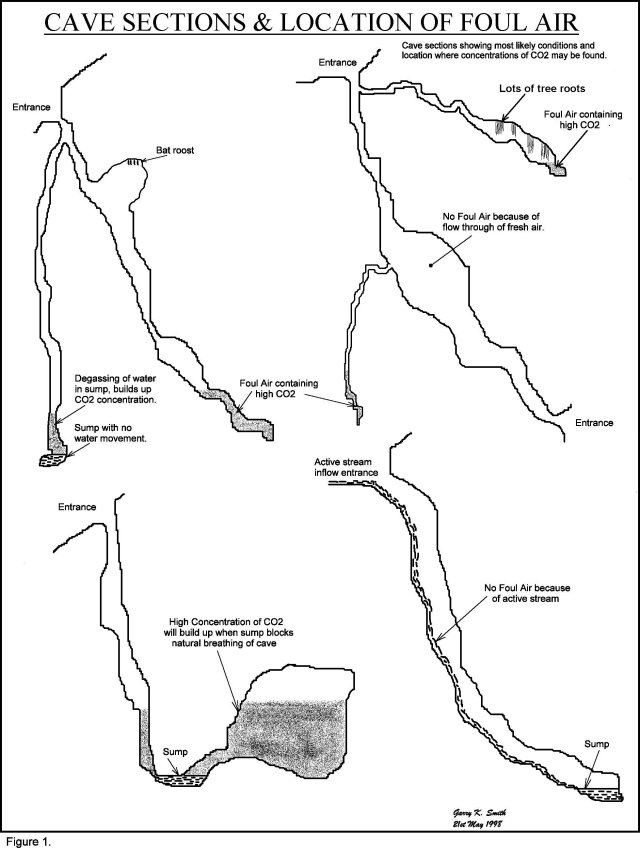
Foul air will not build up in caves with two entrances at different elevations, as temperature gradients cause a flow through affect which flushes the cave atmosphere. Active stream-ways in caves also dissipate any build up of foul air. See Figure 1 below
Calculating gas concentrations in a cave atmosphere.
In dry air the total pressure (of a mixture of gases) is equal to the sum of their partial pressures. In simplified terms, the atmospheric or barometric pressure of dry air is equal to pNitrogen (pN2) + pOxygen (pO2) + pRare Gases (pRG) + pCarbon Dioxide (pCO2).
However since a great majority of cave atmospheres contain high humidity, the water vapour component should be included in the equation.
Barometric Pressure = pN2 + pO2 + pRG + pCO2 + pH2O.
Halbert (1982) uses the Cave Air Index (CAI) to characterise gas mixtures found in caves on a dry atmosphere basis. The water vapour component in the calculation, slightly changes the concentrations of CO2 and O2, but does not affect the arguments derived from the data. Essentially the water vapour constitutes about 0.5% by volume of a saturated cave atmosphere at 20°C and conversely in a dry atmosphere it would be 0%.
For simplicity cave atmospheres may be considered to consist of O2, CO2, and a Residue Fraction (RF) made up of rare gases, N2 and water vapour (H2O).
Table 1. Cave air scenario and correlation with “Foul Air Type” & Cave Air Index.
| Foul Air Type (after Halbert 1982) | Possible Mixes | Cave Air Index |
| 1 | 4 < CAI < 5 | |
| 1+2 combination | 1+3 | 1 < CAI < 4 |
| 2 | 2+1, 2+3, 1+3 | 0.75 < CAI < 1 |
| 2+3 combination | 1+3 | 0 <CAI <0.75 |
| 3 | CAI = 0 |

Interpreting Foul Air.
The theoretical “Foul Air Type 3”, where CAI = 0, is rarely known to exist in caves. In general cave atmospheres with CAI of < 0.75 are regarded as falling into the Foul Air Type 3. This could be a mixture of “Foul Air Types” (3+1) or (3+2). Halbert (1982) gives the example of “Foul Air Type 3” atmospheres containing 1% CO2, 17% O2, and 82% RF and another with 4.5% CO2, 10.5% O2, and 85% RF. He points out that a low absolute O2 concentration does not need to be present. However in practice “Foul Air Type 3” atmospheres likely to be encountered in caves will have low O2. Also this type of foul air may have deceptively low CO2.
At Bungonia Caves (N.S.W.) Australia, foul air accumulation by loss of CO2 from saturated ground water is not the major source, but a contributing factor. CO2 levels of up to 6% have been linked to micro-organisms (i.e. fungi and bacteria) which depend on the nutrition present in organic material leached down from the soil or washed into the caves by floods. These organisms produce CO2 as a by-product of their digestion process. This mechanism was observed to correlate with the reduction in O2 accompanied by the increase in CO2 concentrations. This would suggest foul air Type 2 or a combination of 1 & 2. (Crawshaw. R. and Moleman, D, 1970), (Jennings. J. et al., 1972), (Smith., G, 1993)
Halbert (1982) suggests that some readings at Bungonia are a “Foul Air Type 3”. They include atmospheres in Grill Cave with a composition of 1.4% CO2, 12.0% O2, 86.6% RF which gives a CAI of 0.16 and readings in Odyssey Cave of 2.8% CO2, 14.5% O2, 80.3% RF which gives a CAI of 0.43. James (1977) had previously speculated on the possible sources of “Type 3” foul air sometimes found at Bungonia. These include:- (1) Anaerobic bacterial action - nitrogen producing bacteria which have been identified in caves at Bungonia. (2) Removal of O2 from the cave atmosphere by oxidation of inorganic or organic sediments.
In 1958 members of Sydney University Speleological Society (S.U.S.S) confirmed that readings of up to 13.5% CO2 at Wellington and Molong Caves (N.S.W.) Australia, were at the expense of oxygen. ie. the sum of CO2 and O2 was constant and the percentage of inert gases was reasonably constant. They also concluded that this was probably due to organic decomposition. (Halbert., E. J. 1972). These CO2 readings appear to be exceptionally high and one would wonder if another mechanism could be involved. The answer could be in a later study of the ‘CO2 Pit’ in Gaden Cave - Wellington (N.S.W.) Australia, by Osborne (1981), when he surmises that the atmosphere is most likely due to degassing of the extensive underground lake system with some involvement of a type 2 foul air mechanism.
As can be seen from the above, it is one thing to analyse samples of cave atmosphere to determine composition, however the real problem comes with the interpretation of this data to identify the source of the gases, especially if the source is not readily apparent. Calculation of the CAI, appears to be a very valuable tool to assist researchers in identification of foul air types and hence could assist in tracking down the source.
Examples of foul air, theoretical gas concentrations are given in Tables 2, 3 & 4.
Table 2, Theoretical gas concentrations in cave atmosphere. Using scenario 1 with CAI = 4.
| Total CO2 concentration in cave atmosphere | Total O2 concentration in cave atmosphere | Total RF concentration in cave atmosphere |
| 1% | 20.75% | 78.25% |
| 2% | 20.50% | 77.50% |
| 3% | 20.25% | 76.75% |
| 4% | 20.00% | 76.00% |
| 5% | 19.75% | 75.25% |
| 6% | 19.50% | 74.50% |
| 7% | 19.25% | 73.75% |
| 8% | 19.00% | 73.00% |
| 9% | 18.75% | 72.25% |
| 10% | 18.50% | 71.50% |
| 24% | 15.00% | 61.00% |
Table 3, Theoretical levels of gases in cave atmosphere,
Using a combination of scenario 1 & 2, resulting in CAI = 2.
| Total CO2 concentration in cave atmosphere | Total O2 concentration in cave atmosphere | Total RF concentration in cave atmosphere |
| 1% | 20.50% | 78.50% |
| 2% | 20.00% | 78.00% |
| 3% | 19.50% | 77.50% |
| 4% | 19.00% | 77.00% |
| 5% | 18.50% | 76.50% |
| 6% | 18.00% | 76.00% |
| 7% | 17.50% | 75.50% |
| 8% | 17.00% | 75.00% |
| 9% | 16.50% | 74.50% |
| 10% | 16.00% | 74.00% |
| 12% | 15.00% | 73.00% |
Table 4, Theoretical levels of gases in cave atmosphere, Using scenario 2. with CAI = 1.
| Total CO2 concentration in cave atmosphere | Total O2 concentration in cave atmosphere | Total RF concentration in cave atmosphere |
| 1% | 20.00% | 79.00% |
| 2% | 19.00% | 79.00% |
| 3% | 18.00% | 79.00% |
| 4% | 17.00% | 79.00% |
| 5% | 16.00% | 79.00% |
| 6% | 15.00% | 79.00% |
| 7% | 14.00% | 79.00% |
| 8% | 13.00% | 79.00% |
| 9% | 12.00% | 79.00% |
| 10% | 11.00% | 79.00% |
| 15% | 6.00% |
79.00% |
Effect of CO2 on Humans.
As each persons body has a slightly different reaction and tolerance to stressful situations the following symptoms are general, however nobody is immune to the dangers of CO2.
Table 5. Generally accepted physiological effects of CO2 at various concentrations.
| Concentration | Comments |
| 0.03% | Nothing happens as this is the normal carbon dioxide concentration in air. |
| 0.5% | Lung ventilation increases by 5 percent. This is the maximum safe working level recommended for an 8 hour working day in industry (Australian Standard). |
| 2.0% |
Lung ventilation increases by 50 percent, headache after several hours exposure. Accumulation of carbon dioxide in the body after prolonged breathing of air containing around 2% or greater will disturb body function by causing the tissue fluids to become too acidic. This will result in loss of energy and feeling run-down even after leaving the cave. It may take the person up to several days in a good environment for the body metabolism to return to normal. |
| 3.0% | Lung ventilation increases by 100 percent, panting after exertion. Symptoms may include:- headaches, dizziness and possible vision disturbance such as speckled stars. |
| 5 - 10% | Violent panting and fatigue to the point of exhaustion merely from respiration & severe headache. Prolonged exposure at 5% could result in irreversible effects to health. Prolonged exposure at > 6% could result in unconsciousness and death. |
| 10 - 15% | Intolerable panting, severe headaches and rapid exhaustion. Exposure for a few minutes will result in unconsciousness and suffocation without warning. |
| 25% to 30% | Extremely high concentrations will cause coma and convulsions within one minute of exposure. Certain death. |
(Strang. J., and Mackenzie-Wood. P., 1990), (Laboratory Safety Manual, 1992)(Osha Regulated Hazardous Substances, 1990), (Matherson, D., 1983).
Long term exposure to levels of between 0.5 and 1% as may be experienced by personnel on a submarine, is likely to increase calcium deposition in body tissues such as the kidney. (Matherson, D., 1983)
Exposure of between 1 and 2% CO2, for some hours will result in acidosis, even if there is no lack of oxygen. This acid-based disturbance will occur in the human body when the increase in partial pressure of CO2 (pCO2) is greater than 44mm Hg. Acidemia will result and secondary mechanisms are initiated by the body that attempt to prevent drastic changes in pH and tend to return the pH toward normal. “Intracellular buffering, via red cell haemoglobin, phosphate, and protein, exchange intracellular sodium and potassium for the excess extracellular hydrogen ion. In addition, hypercapnia leads to an increase in renal hydrogen ion secretion and net acid excretion, as well as an increase in bicarbonate reclamation. Although this response begins early, the maximum effect takes several days.” (Clinical Management of Poisoning & Drug Overdose, 1990).
Prolonged breathing of air containing around 2% or greater will disturb body function by causing the tissue fluids to become too acidic. This will result in loss of energy and feeling run-down even after leaving the cave. It may take the person up to several days in a good environment for the body metabolism to return to normal.
The “Laboratory Safety Manual (1992)”, quotes 0.5% CO2 as the `Threshold Limit Value Time Waited Average’ (TLVTWA). This is the concentration to which a person may be exposed, 8 hours a day, 5 days a week, without harm. The manual also quotes 5% CO2 and above as being `Immediately Dangerous To Life and Health’ (IDLH). This is the concentration that will cause irreversible physiological effects after 30 minutes exposure.
One must be mindful that the sight of bats in a cave does not necessarily mean that the atmosphere is suitable for humans. On several occasions the author has experienced laboured breathing in caves containing bats, however a simple Butane Cigarette lighter would fail to ignite and struck match head would only fizz before going out. The bats seemed to be undeterred by the low O2 and high CO2 content of the atmosphere. These observations are echoed by Hamilton-Smith, (1972) who states that, “….. the Bent-winged Bat is able to tolerate higher concentrations of gas (CO2) than that acceptable to human beings.”
Effects of O2 Defficiency on Humans.
If we consider an atmosphere consisting of just N2 and O2, where the O2 is at a lower concentration than the normal atmosphere, the human body would be effected in the manner shown in Table 6. (Laboratory Safety Manual, 1992)
Table 6. Generally accepted physiological effects of reduced O2 concentrations.
| O2% by volume. | Symptoms (at sea level) |
| reduced from 21 to 14% | First perceptible signs with increased rate and volume of breathing, accelerated pulse rate and diminished ability to maintain attention. |
| between 14 to 10% | Consciousness continues, but judgment becomes faulty. Rapid fatigue following exertion. Emotions effected, in particularly ill temper is easily aroused. |
| 10 to 6% | Can cause nausea and vomiting. Loss of ability to perform any vigorous movement or even move at all. Often the victim may not be aware that anything is wrong until collapsing and being unable to walk or crawl. This is followed by unconsciousness and death. Even if resuscitation is possible, there may be permanent brain damage. |
| below 6% | Gasping breath. Convulsive movements may occur. Breathing stops, but heart may continue beating for a few minutes - ultimately death. |
(Laboratory Safety Manual, 1992), (Safe Handling of Compressed Gases, 1992), (Strang. J., and Mackenzie-Wood. P., 1990),
Should we be looking at O2 Defficiencies as Life Threatening while Underground?
The partial answer to this question can be found in a paper by Field, (1992) which studied the use of a new fire extinguishing gas mixture, designed to be used in enclosed spaces. The gas called ‘Inergen’ consisted primarily of Argon and CO2. It was designed to disperse and dilute oxygen to below 15% volume, so that there would be insufficient oxygen to support combustion. The research found that the addition of a small percentage of CO2 was beneficial as it induced an immediate and sustained stimulus to increase breathing rates of persons caught in areas flooded with this gas mixture. It was the increase in CO2 and to a much lesser extent the decreased O2 which stimulated the respiratory response.
The report goes on to say that great majority of healthy people whether young or old, would not be limited by their ventilatory function during physical exertion at a work level when breathing air at sea level containing 3.1% CO2 and 15% O2, however many, particularly the elderly would experience mild-moderate breathlessness.
In an atmosphere containing 4.3% CO2 and 12.4% O2, the average healthy person with a reasonable level of physical fitness would be capable of less than half the maximum physical exertion they could normally attain breathing air. (Field, 1992). One thing lacking in this paper is any real mention of time scales of exposure to this concentration of CO2 and O2.
The data as listed in the Tables 6 above, indicates that very little difficulty is caused by short-term exposure to O2 / N2 mixtures down to about 10% O2. In Tables 2, 3 & 4, it can be seen that at 8% CO2 concentration (which is dangerous to humans), there is still sufficient oxygen to support life.
The Australian Standard (AS 2685-1986, P.7) ‘Safe Working in Confined Space’, states that entry to confined space shall not be permitted if oxygen deficiency is below 18%. This standard was revised in 1995 and the minimum concentration raised to “19.5 percent by volume under normal atmospheric pressure, equivalent to a partial pressure of oxygen (pO2) of 19.8kPa …”. it goes on to say that “an airborne concentration of a particular substance in the person’s breathing zone, exposure to which, according to current knowledge, should not cause adverse health effects nor cause undue discomfort to nearly all persons.” The criteria used is the Time-Weighted Average (TWA). “The average concentration of a particular substance when calculated over a normal eight-hour workday, for a five-day working week.” (AS 2865-1995, P. 6-7). One could argue that this is a very conservative O2 concentration, designed for the workplace to cater for people with a very wide range of physical fitness and ailments and the possible need to undertake continuous strenuous work over an 8 hour day.
One should note that it is simply not just the O2 volume percent which is necessary for human respiration but the O2 partial pressure. For instance the O2 partial pressure decreases at higher altitude while the O2 volume percent remains constant. An example of this is the partial pressure of O2 at an altitude of 2,000 metres above sea level is 17.67kPa (176.7 millibar) and this is equivalent to breathing air in which the O2 concentration has been reduced to 17.5%.
How the Human Body gets rid of CO2.
The human body under average conditions inhaling air which contains approximately 21% oxygen and 0.03% CO2. The air breathed out of the lungs contains approximately 15% to 16.3% oxygen and about 4.5% CO2. A person at rest inhales and exhales approximately 6 litres of air per minute but in times of stress, this may increase to more than 100 litres per minute.
The CO2 level in the blood is an important stimulus to respiration. Nerve receptors in the aorta near the heart and in the carotid artery that goes to the brain, monitor changes in the CO2 in the body. If the amount of CO2 in the blood increases, both the rate and depth of breathing increases. Changes in oxygen levels are also monitored, but the receptors are not as sensitive to changes in oxygen as to CO2.
The exchange of the two gases (CO2 and O2) takes place in the lungs by diffusion across the walls of the air sacs (alveoli). Oxygen from inspired air diffuses across the lining of the air sacs and enters the circulation, while CO2 moves in the opposite direction. Then the gases are transported between cells and the lung by the blood circulation.
The principle by which diffusion occurs dictates that a gas in high concentration will move to an area of relatively low concentration, until an equilibrium is reached. This enables CO2 in the body at a higher concentration to diffuse to the inhaled air. (Smith. G. K., 1993 & 1997b).
Simple Test for Foul Air.
In the majority of foul air found in caves, the real danger is the CO2 concentration which is the main trigger for the human body to increase the breathing rate. This is generally attributed to a Type 2 Foul Air or possibly a mixture of Types (2+1) or (2+3). Prolonged exposure to a concentration of just 6% CO2 or more may be enough to cause suffocation. In the majority of cases, if a person has any of the symptoms of elevated carbon dioxide, a simple ‘naked flame test’ will fail to ignite.
The ‘naked flame test’ can be undertaken by igniting a match or butane cigarette lighter or carrying a lit candle into suspected foul air. If the flame is extinguished, foul air is present. Where possible a butane cigarette lighter should be used to reduce unpleasant fumes emitted from matches burnt by people testing air quality in the confines of a cave. (Smith. G. K. 1997a)
Laboratory tests have proven that combustion of a match, candle or butane cigarette lighter will cease at about 14.5% to 15% concentration of oxygen. Twenty one percent (21%) being the oxygen concentration in normal atmosphere. Bearing in mind that humans on average breath out air containing between 15% - 16.3% oxygen and this is enough to revive a person using Expired Air Resuscitation (EAR). In fact humans can survive in an atmosphere containing 10% oxygen, so when the flame test just fails, the atmosphere still containing enough oxygen to survive. (Smith. G. K. 1997a)
Conclusion
In the majority of cave atmospheres an elevated CO2 concentration, corresponds to a depletion of O2. A high CO2 concentration is the most life threatening situation encountered underground while a life threatening low O2 concentration is rarely encountered. The majority of dangerous atmospheres in caves can be contributed to a combination of Type (2+1) & (2+3) Foul Air. This covers a considerable range of CO2 to O2 combinations, however when CO2 is high so as to be dangerous to humans, there is generally not enough O2 to support combustion.
The first signs of high CO2 include increased heart and breathing rates, headaches, clumsiness, fatigue, anxiety and loss of energy
Without sophisticated measuring equipment, the best advice is if you or a member of your group experiences any of the common side effects of CO2, carry out a simple flame test with a butane cigarette lighter. If the flame fails to ignite notify others in the party and the group should vacate the cave in a safe manner.
Carbon dioxide when treated with respect is no worse than the other dangers in caves. Despite the possible dangers, caving is still safer than driving a motor vehicle, which most of us take for granted. The best advice is, “If in doubt, get out”.
Bibliography and References.
AS 2865-1986, “Australian Standard” (1986), ‘Safe working in a Confined Space’, Published by Standards Australia (Standards Association of Australia)., 42pp, ISBN 0-7262-9473-X.
AS 2865-1995, “Australian Standard, Worksafe Australia National Standard” (1995), Published by Standards Australia (Standards Association of Australia)., ‘Safe working in a Confined Space’, 48pp, ISBN 0-7262-9473-X.
“Clinical Management of Poisoning & Drug Overdose”, (1990) edited by Haddad, Lester M; Winchester, James F., 2nd ed. Philadelphia : Saunders p. cm. Published in Pennsylvania. ‘Clinical Features & Consequences of Metabolic Acidosis’. P.135-140, ISBN: 0721623425
Crawshaw, R. and Moleman, D., (1970) “Experiments with cave atmospheres: The CO2 Problem”. Published in the Sydney Speleological Society. Journal, Vol. 14, No. 8, P. 177-185.
Field. Dr. G., (August 1992), “The Physical Effects on Humans of Exposure to Gas Mixtures of Air and Inergen”, Report prepared on behalf of Unisearch Limited, Department of Respiratory Medicine - The Prince of Wales Hospital, for Grinnell Asia Pacific Pty Ltd.
Friedman. R., (Nov. 1989), “Principles of Fire Protection Chemistry”, Printed by the National Fire Protection Association USA. ISBN 0-87765-363-1.
Halbert. E.J. (1972),. ‘Foul Air in Bungonia Caves’, Published in “Bungonia Caves”, by the Sydney Speleological Society. Occasional Paper No. 4, P. 144-146. ISBN 0-9599608-0-5.
Halbert. E.J.M., (1982), “Evaluation of Carbon Dioxide and oxygen data in atmospheres using the Gibbs Triangle and Cave Air Index.” Printed in Helictite, V.20 (2), P.60-68, Journal of Australasian Cave Research.
Hamilton-Smith. E., (1972) ‘Bats of the Bungonia Caves’, Published in “Bungonia Caves”, (1972) by the Sydney Speleological Society. Occasional Paper No.4, P.151-156. ISBN 0-9599608-0-5.
James. J. M., (1977), “Carbon Dioxide in the Cave Atmosphere”. Transcript of the British Cave Rescue Association. V. 4, No.4, P. 417-429.
James. J., and Dyson, J., (1981), “CO2 in Caves” Published in Caving International Magazine (Cave Science Topics) No. 13, October 1981 P. 54-59.
Jennings. J. N., James. J. M., Counsell. W. J., and Whaite. T.J. (1972) ‘Geomorphology of Bungonia Caves and Gorge’, Published in "Bungonia Caves", (1972).by the Sydney Speleological Society. Occasional Paper No.4, P.113-143. ISBN 0-9599608-0-5.
“Laboratory Safety Manual”, (October 1992), ‘Oxygen-deficient Atmosphere’, Section 24, P.4-5. By the Occupational Health & Safety Unit of the University of N.S.W, Australia. Published by CCH Australia Limited. ISBN 1- 86264-439-X. Authors - R. Haski, G. Cardilini and W. Bartolo.,
Matherson, D., (1983) Article on ‘Carbon Dioxide’ Hazards in the“Encyclopaedia of Occupational Health and Safety”. (Third edition 1983),Published by the International Labour Organisation, CH-1211 Geneva 22, Switzerland.,. P. 392-393 ISBN 92-2-103289-2
“McGraw - Hill Encyclopedia of Science & Technology”, (1982), fifth edition, Chemical Weathering P. 305. ISBN 0-07-070280-1
Osborne. R.A., (1981), “Toward an air quality standard for tourist caves: Studies of Carbon Dioxide enriched atmospheres in Gaden - Coral Cave , Wellington Caves, N.S.W.” Printed in Helictite, V. 19 (2), P. 48-56, Journal of Australasian Cave Research.
“Osha Regulated Hazardous Substances” (1990). Occupational Safety and Health Administration U.S. Department of Labor. ISBN 0-8155-1240-6.
“Safe Handling of Compressed Gases”, (1992). P.5, Sec. 3.5, Commonwealth Industrial Gases Ltd, Aus. ISBN 0-909327-09-2
Smith. G.K., (1993), “Caves, Carbon Dioxide & you”, Published in ‘Australian Caver’, No. 133, P. 20-23. Journal of the Australian Speleological Federation Inc.
Smith. G.K., (1997a), “Naked Flame Tests for CO2 in Limestone Caves & The Effect of CO2 and O2 on Humans”, published in the ‘Australian Speleological Federation Inc. Proceedings of the 21st Biennial Conference’, P. 40-52.
Smith. G.K., (1997b), “Caves, Carbon Dioxide & You.”. published in the ‘Australian Speleological Federation Inc. Proceedings of the 21st Biennial Conference’, P. 35-39. Updated from the original article publication in 1993.
Smith. G.K., (1998), “Foul Air at Bungonia”, published in ‘Under Bungonia’, P. 84 - 91, Life on Paper Publishing, PO Box 115 Oak Flats, 2529. NSW Australia.
Strang. J. and Mackenzie-Wood. P., (1990). “A Manual on Mines Rescue, Safety & Gas Detection”. Printed by CSM Press, School of Mines Colorado. P. 126-133
Comments are most welcome.